Index (passive) investing has been winning the battle for investor capital for decades. At the end of 2023, passive fund assets passed active for the first time, and the gap has widened every year since. In this article, we explore why it happened, where active investing still fits, and how Brightward Financial builds portfolios using a core-satellite approach customized to each client.
How we got here
Mutual funds date back to 1924, and the Investment Company Act of 1940 gave the industry its rulebook. The pitch was simple: instead of buying a handful of stocks yourself, you hire a professional to do the research, execute the trades, and keep you diversified. The idea caught on, and the industry boomed. At the end of 2025, there were 8,030 U.S. mutual funds and 4,813 ETFs, against roughly 3,657 U.S. companies listed on the major exchanges.
Starting half a century later, and running on a parallel track, Jack Bogle launched the first index (passive) mutual fund for individual investors in 1976. It became the Vanguard 500 Index Fund, but it took a long time to catch on. In 1995, index funds in aggregate held about 2% of mutual fund assets. By 2010, index funds and ETFs were 19% of long-term fund assets. By 2020, 40%. By the end of 2025, 52%. The trend shows no signs of slowing down.
Why passive keeps winning
The core argument is arithmetic. Nobel laureate William Sharpe laid it out in 3 pages in 1991. In short, passive investors own the market, so all active investors, together, own it too. Before costs, the average active dollar must earn the market return. After costs, it must earn less. The logic is airtight, and the data has confirmed it. Over the 20 years through June 2026, ~90% of active large-cap U.S. funds trailed the S&P 500, including funds that were shut down over the time period.
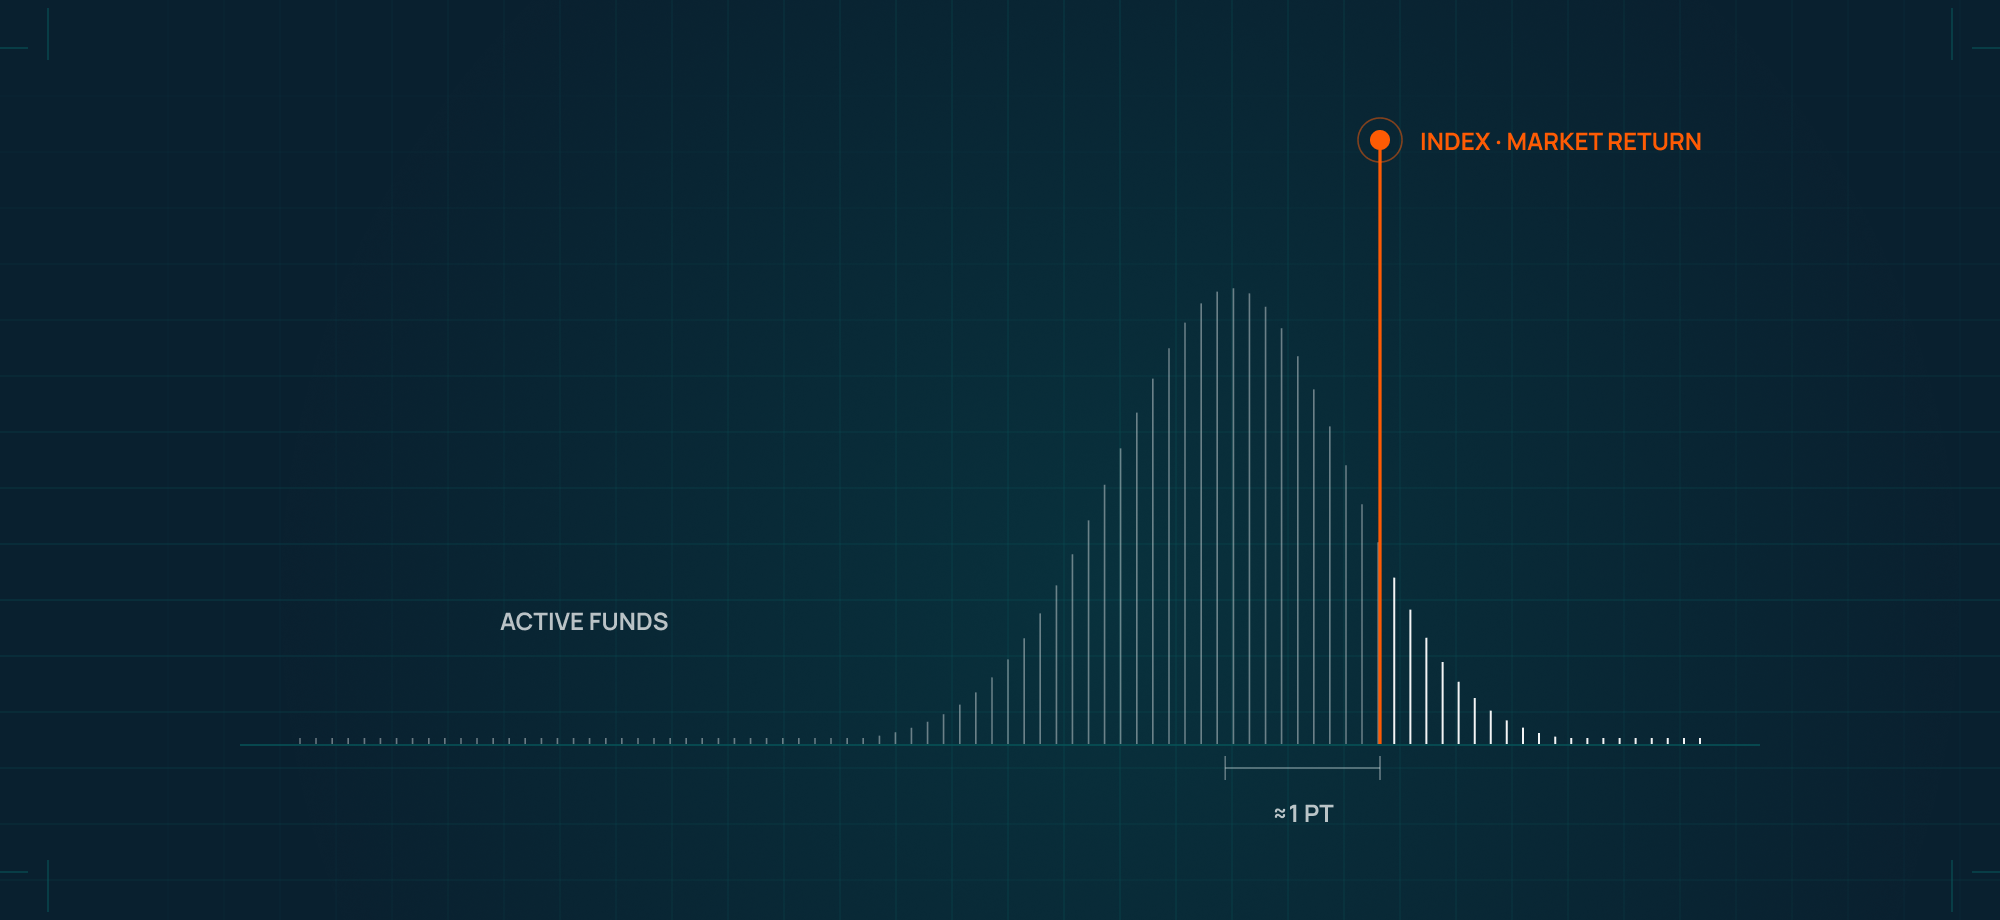
Pick a large-cap fund at random 20 years ago and your odds of beating the index were about 1 in 10. Over this time, the average dollar in active large-cap funds (asset-weighted) compounded at 10.3% a year while the S&P 500 did 11.4%. That’s about 1 point a year, roughly their fees plus trading costs, which is exactly what Sharpe’s arithmetic predicts.
The distribution of returns
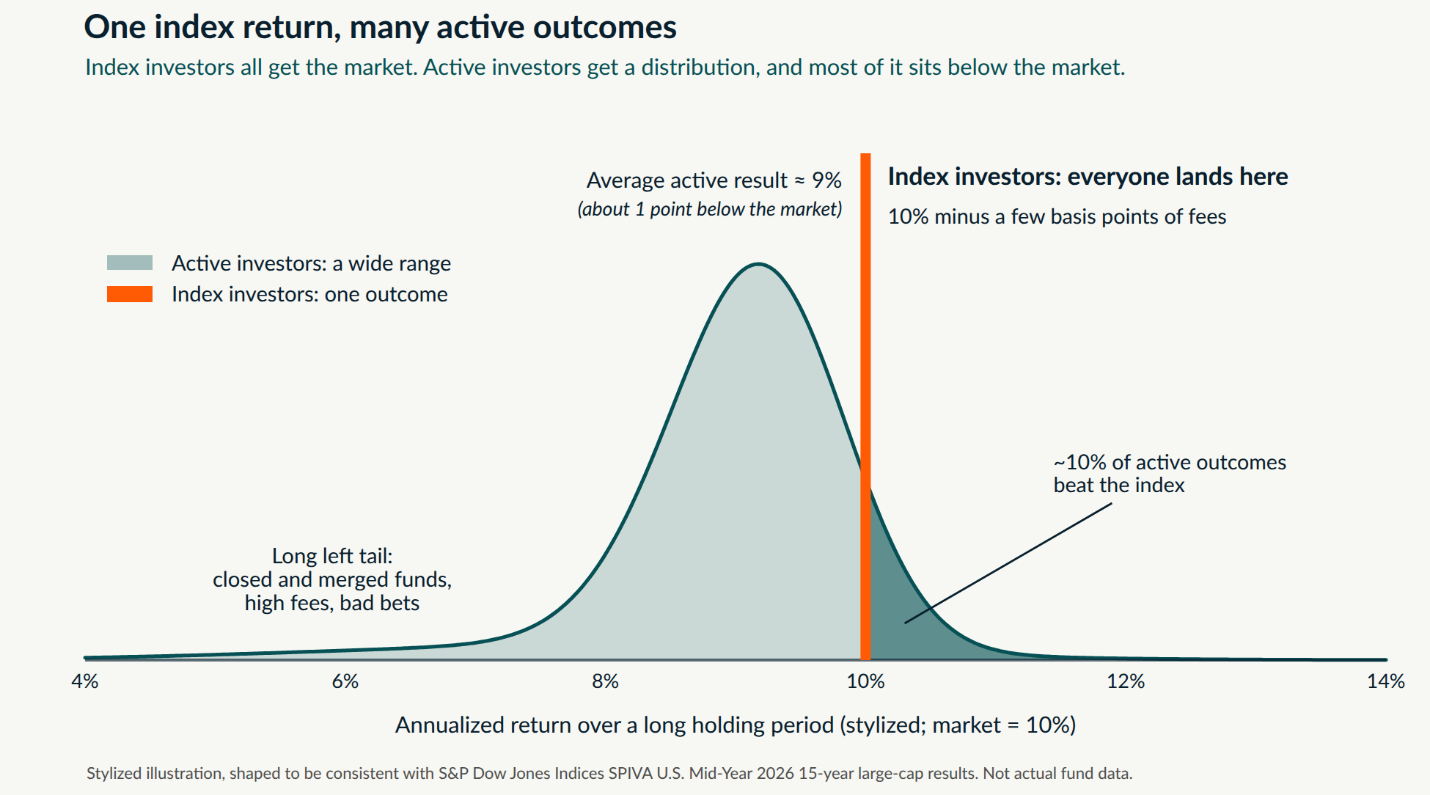
The chart above is stylized (we set the market return at 10% to keep the math simple), but the shape is right. The curve has a long left tail, and the average active result lands about 1 point below the market.
- Index investors all get the same result: the market return, less a few basis points.
- Active investors get a range of results. Before costs, you’d expect roughly half to land above the market and half below. Fees and trading costs shift the whole curve left. Then survivorship stretches the tail: SPIVA counts funds that closed or merged as underperformers, and over 20 years that’s a large share of the starting lineup. Put the shift and the tail together and only ~10% of active funds beat the index net of fees.
The headwinds to most active approaches
- Most managers are boxed in. Diversification rules cap how concentrated a fund can be. The rise of mega-cap companies over the last 10 years has hurt most active managers who couldn't own the top 10 stocks at conviction weights.
- Active managers have short time horizons. Most managers are paid annually, and a bad year or two can cost them a bonus, or sometimes their job. So the rational move is to hug the benchmark and survive, rather than try to engineer differentiated, exceptional outcomes.
- Stock returns are skewed. Hendrik Bessembinder studied every U.S. stock from 1926 to 2016. Only 42.6% beat Treasury bills over their lifetimes, and about 4% of companies created all of the market’s net wealth. See here for that research.
The two extremes of portfolio construction
All active: di-worse-ification
In the 1990s and 2000s, advisors commonly built portfolios from a pile of mutual funds. We’ve reviewed multiple accounts that held 25-50 active mutual funds. No surprise, these accounts performed poorly over the long term. Picture 5 managers each in large-cap, mid-cap, small-cap, international, and emerging markets. That’s 25 active managers, each holding 50 to 100 stocks. You’ve rebuilt the index. You’re just paying 1% per year for it instead of 0.05%. That’s di-worse-ification. This old-school approach and the advisors who use it need to be retired.
All passive: cheap, with trade-offs
Other advisors have swung to the opposite extreme and put clients in 100% index funds. It’s a big improvement, and the fee savings alone can be worth most of a percentage point a year. Taken to its logical end, you could buy one total-world stock ETF like VT (0.06% expense ratio) and call it a day for your equity exposure.
But a bit of nuance is also warranted. Index investing is superior on average, but not always. What’s right for a given client depends on preference, risk tolerance, and goals.
We see 3 potential drawbacks for the 100% passive approach:
- It rules out any chance of beating the market. Yes, ~90% of active funds trailed the index over 20 years. But the investors who got truly wealthy did it through concentration.
- You participate fully in every drawdown. Some people can hold firm when the market crashes, but many can’t, and selling near the bottom costs far more than saving 1% in fees.
- It’s boring. This is a human argument, but it matters. Some people are OK with boring. But for others, a portfolio of thousands of stocks gives you nothing to understand or believe in. If conviction keeps you engaged in your financial progress and invested through bad years, then active management serves a behavioral purpose.
How we try to improve the odds
We’ve established that the odds are against active investors as a group. But the headline numbers reflect averages, not individual experiences. We try to add value and tilt the outcomes in our favor in three ways:
- Selection of outside managers. When we select an active manager, we don’t di-worse-ify with 25 mutual funds on top of each other. Our process is more surgical and specialized. We’re looking for 2-4 high-conviction managers. We are looking for:
- Below-average fees for the strategy
- A compelling long-term track record
- A stable parent company with good governance
- Managers with meaningful money in their own funds
- A repeatable process and an edge we can describe
- A structure and incentives that let the manager take a long view
- Selection of individual stocks. Bessembinder’s finding cuts both ways. If a few percent of companies create all the wealth, owning everything guarantees you hold them, and a concentrated portfolio can miss them. We think those winners share traits you can spot ahead of time, so we look for businesses with:
- Durable competitive advantages
- Secular growth prospects
- Strong balance sheets and cash flow
- Businesses we can understand and hold for a long time
- Tilting the index. An index fund owns the good with the bad. In practice, the winners swamp the losers, and you end up in a decent place. But you can also underweight the unpromising parts of the market and overweight the promising ones, tilting the odds in your favor. We attempt to do so in two ways:
- Factor funds. Low-cost, rules-based funds that systematically underweight companies with traits that have historically come with lower returns. These funds might cost 0.15% instead of 0.05%, and we expect them to generate enough extra performance to justify the marginally higher fee.
- Country and sector tilts. We steer away from countries with weak rule of law or poor corporate governance, and from governments hostile to innovation and growth. We tilt toward industries we think have better prospects.
The Brightward approach: core and satellite
The core is low-fee, diversified index ETFs (what practitioners call beta). Its job is to deliver the market return with as little drag as possible.
The satellite is where we’re active. It’s the part of your return that will differ from the index, using the approaches mentioned above to tilt the odds in your favor.
For clients who want to stay close to the index, the core is 90% to 100% of the portfolio. For clients who want more room to differ, the core could be as small as 60% of the portfolio.
Our job is to control what we can (cost, discipline, where we take risk) and to be honest that beating the market is never guaranteed. We think a disciplined process improves the odds.
Sources
S&P Dow Jones Indices, SPIVA U.S. Scorecard, Mid-Year 2026 (data as of June 30, 2026; 10-, 15- and 20-year large-cap underperformance rates and asset-weighted returns). Investment Company Institute, 2026 Investment Company Fact Book (fund counts; index share of long-term fund assets) and Trends in the Expenses and Fees of Funds, 2025 (asset-weighted expense ratios). IMF, Global Financial Stability Report, April 2017 (1995 index share, from ICI data). Jay R. Ritter, University of Florida, using CRSP (listed-company count). H. Bessembinder, “Do Stocks Outperform Treasury Bills?” Journal of Financial Economics, 2018. W. Sharpe, “The Arithmetic of Active Management,” Financial Analysts Journal, 1991. Vanguard (VT expense ratio). Morningstar, U.S. Fund Flows, December 2023 (passive fund assets surpassing active).
Important disclosures
Brightward Financial, LLC is an investment adviser registered with the State of Colorado. Registration does not imply a certain level of skill or training. This page describes our general approach and is for informational purposes only. It is not investment advice, an offer, or a recommendation to buy or sell any security, and it is not a promise of any particular outcome. Any fund named here, including VT, is an illustration, not a recommendation. Investing involves risk, including the possible loss of principal. Concentrated portfolios and sector tilts carry more risk than broadly diversified index portfolios and can trail the market for extended periods. Diversification does not guarantee a profit or protect against loss. You cannot invest directly in an index, and index returns do not reflect fees. Third-party data are from sources we believe reliable but have not independently verified. Past performance does not guarantee future results. Updated October 2026.