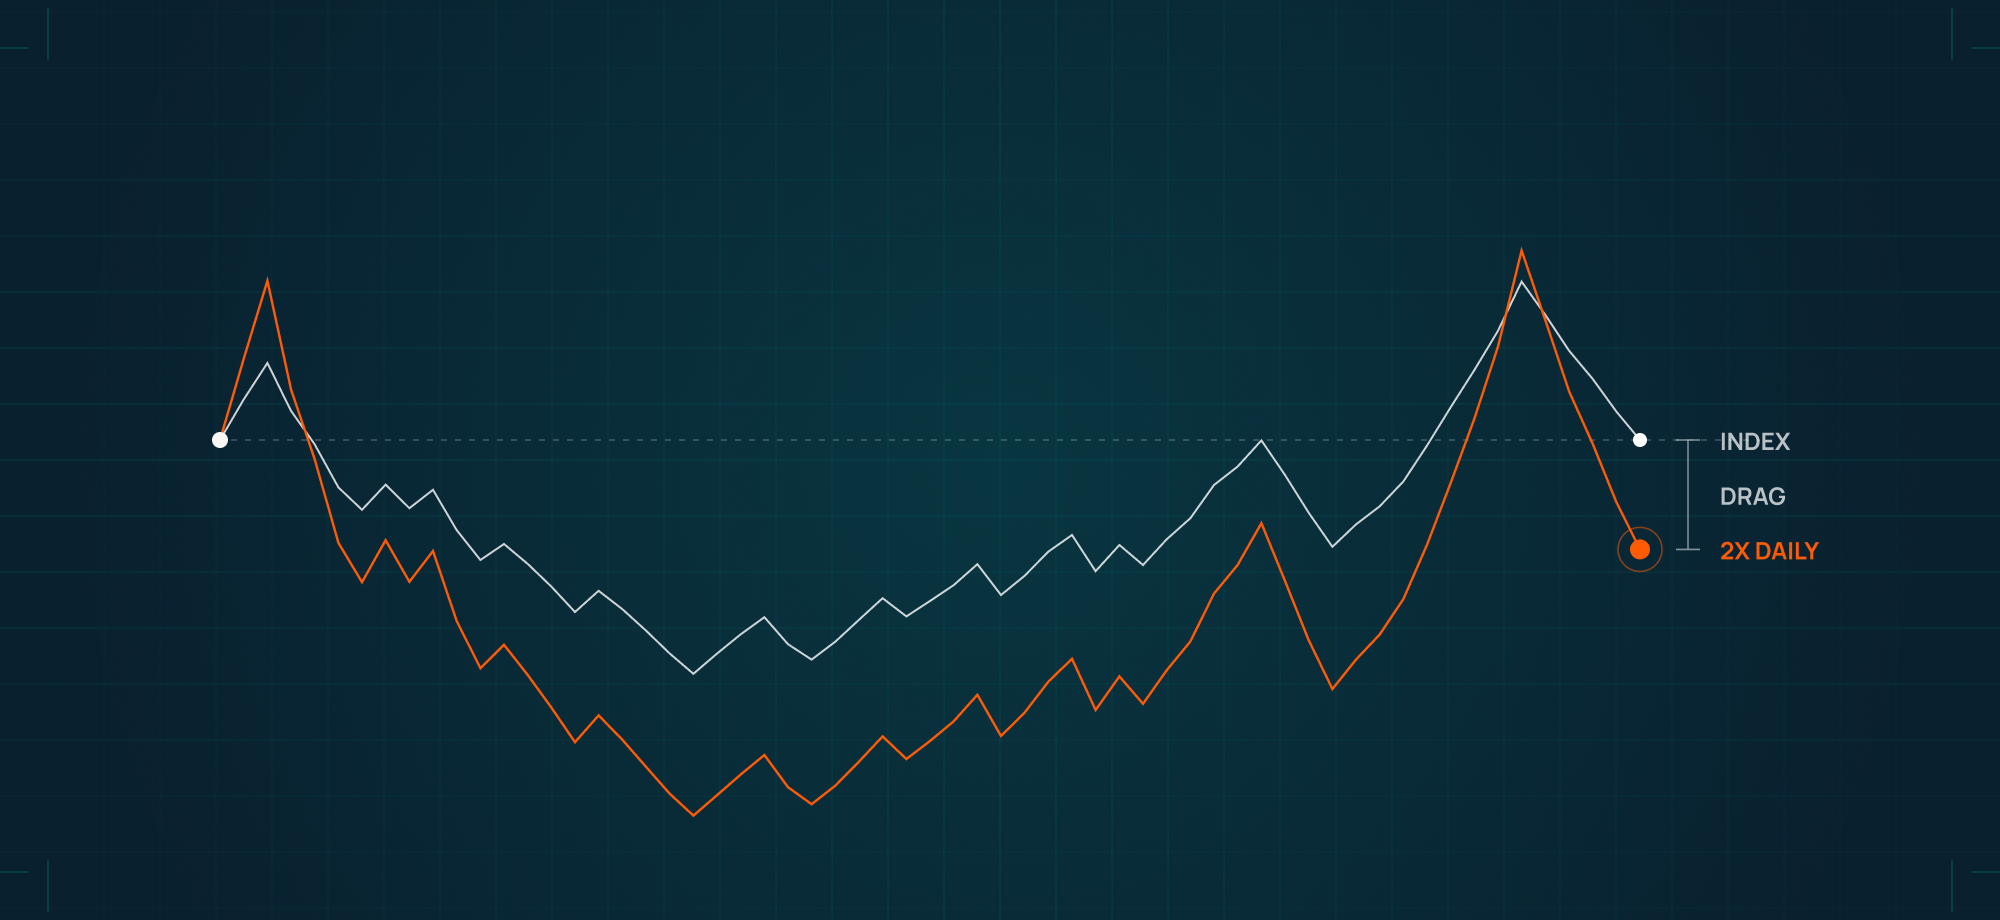
In November 2008, Direxion launched two ETFs on the same index of large U.S. financial sector stocks. Their timing was inauspicious, as the Global Financial Crisis was already underway. FAS promised 3x the index’s daily return. FAZ promised negative 3x. Surely one of these would be a huge winner! By June 2010, the underlying index was up 10%. You’d expect FAS to be up around 30% and FAZ down around 30%. In reality, FAS was down 72%. FAZ was down a staggering 98%. This fascinating case study (albeit of an extreme period for bank stocks) is detailed in a paper by Ilan Guedj, Guohua Li, and Craig McCann, published in the Journal of Index Investing in 2010.
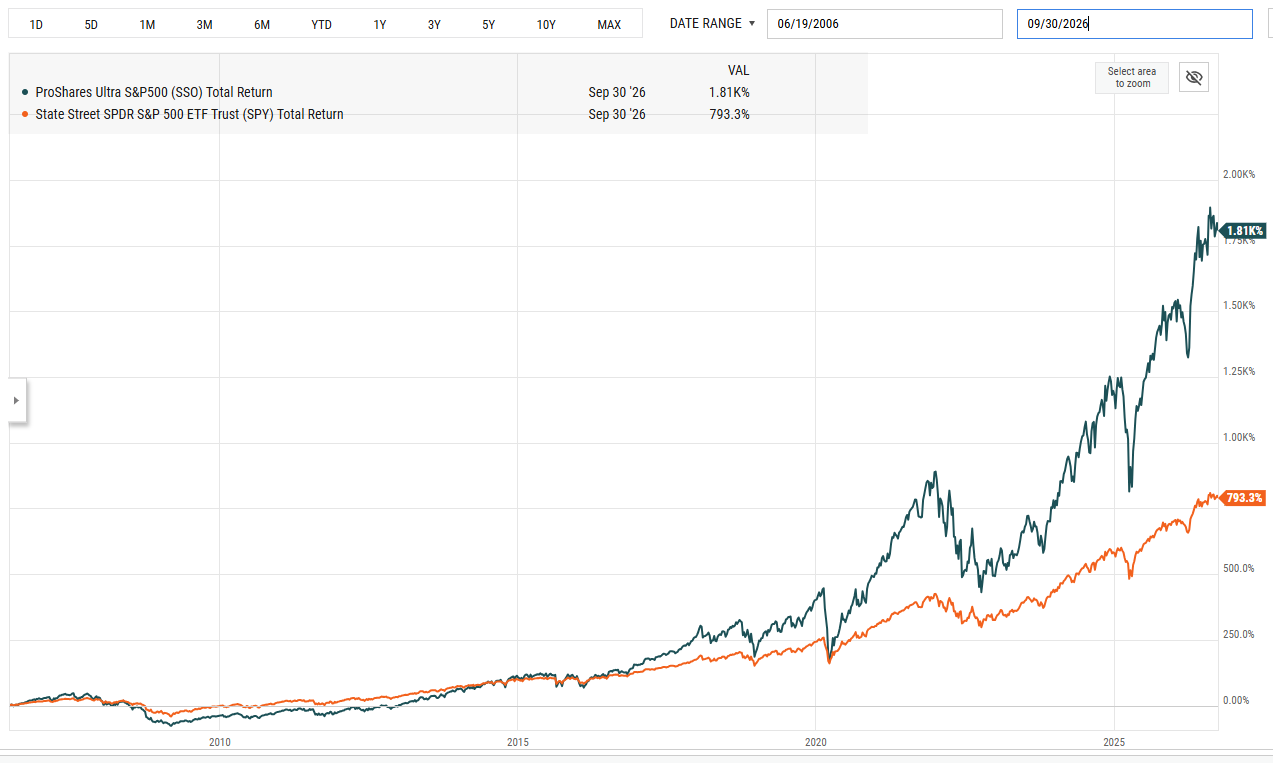
On the other hand, some leveraged ETFs have performed well. The ProShares Ultra S&P 500 (SSO), a 2x leveraged ETF, has returned 1,810% since inception in June 2006, while the underlying index has returned 793%. Annualized, SSO returned 15.7% compared to 11.4% for SPY.
Despite their spotty track record, leveraged ETFs have become a fast-growing part of the current bull market. In 2019, there was $33.9 billion in leveraged ETFs. By June 2026, U.S. leveraged ETF assets passed $192 billion, a six-fold increase in seven years. This rapid growth reflects risk-seeking behavior after several years of strong gains, and a fund management industry eager to make a quick buck by any means necessary.
How does a leveraged ETF work?
Leverage cuts both ways, magnifying returns on the upside and losses on the downside. But the problem is more pernicious because of a concept called volatility drag. To understand this concept, we need to dig into the details.
A leveraged ETF uses futures contracts to target a multiple of one day’s return. A 2x S&P 500 fund seeks to return 2% on a day the index returns 1%. Most of these funds achieve their daily goal. The trouble starts on day two, because the fund resets its exposure every night and compounds from a new base.
Here’s a simple example to build intuition for why this is a problem. Suppose an index starts at $100, falls 10% one day and rises 11.1% the next. The total return is 0%. A 2x fund drops 20% to $80, then gains 22.2% to about $97.80. The index is flat, but the fund is down 2.2%. At 3x leverage, the same 2-day thought experiment would leave the fund down almost 7%. Fees and leverage costs make the problem even worse.
For our mathematically inclined readers, the formula is:
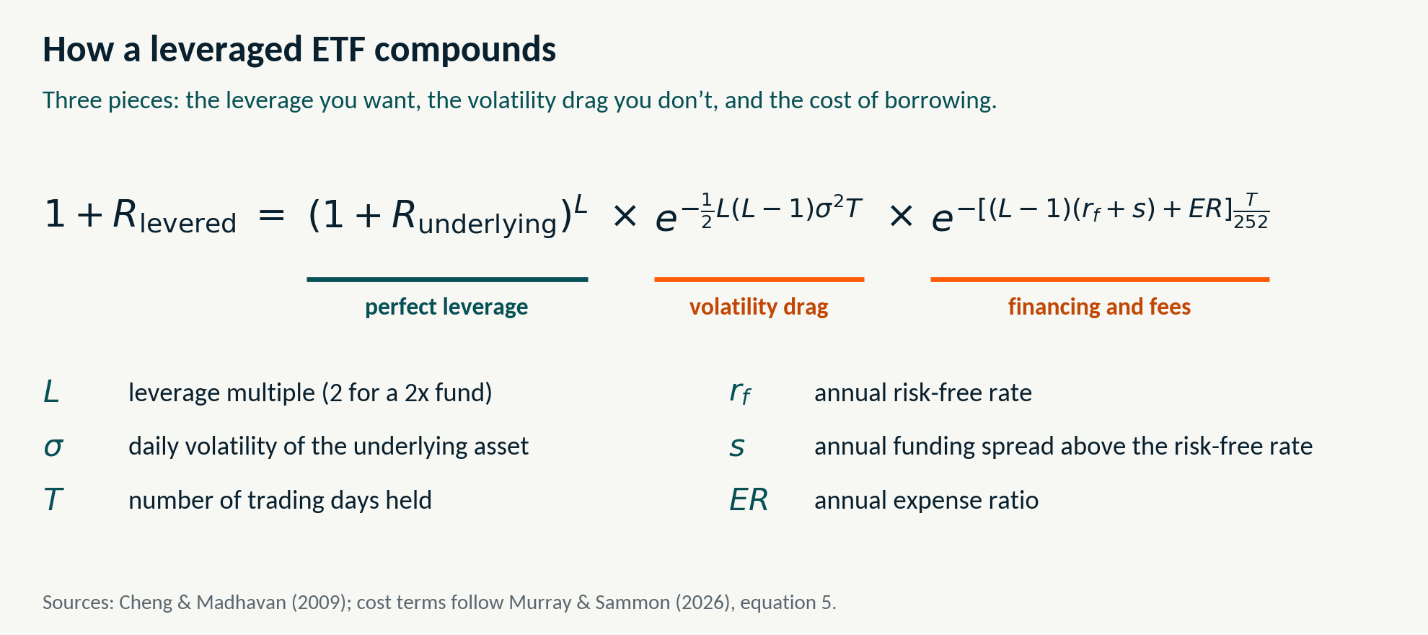
The 2x fund return will be worse than a perfectly compounded leveraged return because the volatility drag term is always negative, and because leverage costs and product fees also drag returns. The volatility drag scales linearly with time and with the square of the underlying asset’s volatility.
In plain English, the longer you hold one of these funds, the higher the underlying asset’s volatility, and the higher the leverage used, the greater the volatility drag.
The hurdle rate
A Harvard University working paper from August 2026 by Murray and Sammon comes at this from a useful angle: how much does the underlying asset need to return in a year for a 2x fund to match it?
Using their assumptions about fees and financing, an asset with roughly S&P 500-level volatility (~16% per year) needs to return ~8.4% for the 2x fund to break even. Below that, the 2x fund underperforms the plain index (even if the underlying index has a positive return). Above that, the 2x fund wins, but still earns less than double.
In the last 15 years of strong equity returns, some 2x ETFs based on broad market indices have outperformed. But since 8.4% is close to the long-term stock return, index-level 2x ETFs may be more of a coin flip from a total-return standpoint, with a worse risk-adjusted profile and a much higher risk of adverse outcomes.
Levered single-stock funds are a different story
The fastest-growing corner of the levered ETF market is not on broad indices, but rather on individual companies like Tesla and Nvidia, and these investments are an order of magnitude worse than the S&P 500 example above. In 2025, the stocks behind the single stock funds averaged 3.71% daily volatility, versus 1.35% for the broad indices. That works out to ~7.6 times the volatility drag of the diversified funds.
Financing costs for single stocks are higher too. Murray and Sammon estimate single-stock funds pay 6.8% to 9.8% a year above the risk-free rate for their borrowed exposure. Index funds pay under 1% spread.
To build intuition around this dynamic, let’s look at a 2x NVDA fund, assuming NVDA has 50% annual volatility and that fees and funding costs are 11%. It turns out the hurdle rate for this 2x fund is not 8.4% as is the case for S&P 500. It’s 44%. Here’s how the math works:
Let’s say that clearly: NVDA has to gain 44% in a year before the 2x fund earns a single dollar more than the stock! That’s an aggressive hurdle rate. It gets worse. NVDA, the world’s largest company, is less volatile than many other stocks with 2x ETFs. For the average stock with a 2x ETF, the hurdle rate is 61%. Betting the broad market will return at least 8.4% is at least a justifiable bet. Betting any stock returns more than 60% is foolhardy.
Built for gamblers
These products appeal to investors with “lottery preferences”: a willingness to take long odds for a shot at an outsized payoff. The opportunistic ETF industry is happy to oblige, for a hefty fee. Murray and Sammon found that single-stock funds get launched on fashionable, highly publicized stocks that are already among the most volatile and the biggest recent winners.
While the SEC’s 2020 derivatives rule (Rule 18f-4) grandfathered the few existing 3x funds that have survived, it bars new funds above 2x. And in December 2025, the SEC blocked a wave of 3x-to-5x filings, a move we applaud. While 3x to 5x levered funds may be categorized as weapons of financial mass destruction (to paraphrase Warren Buffett), we think 2x funds on single stocks are a bad idea. The cost of leverage, fees, and volatility drag conspire against the investor, widening the range of outcomes, shifting the distribution leftward, and increasing the odds of permanent capital impairment.
Can you withstand an 80% drawdown?
The long-run performance of SSO versus SPY may tempt some to buy a levered ETF, but it’s worth looking at the actual volatility you had to endure.
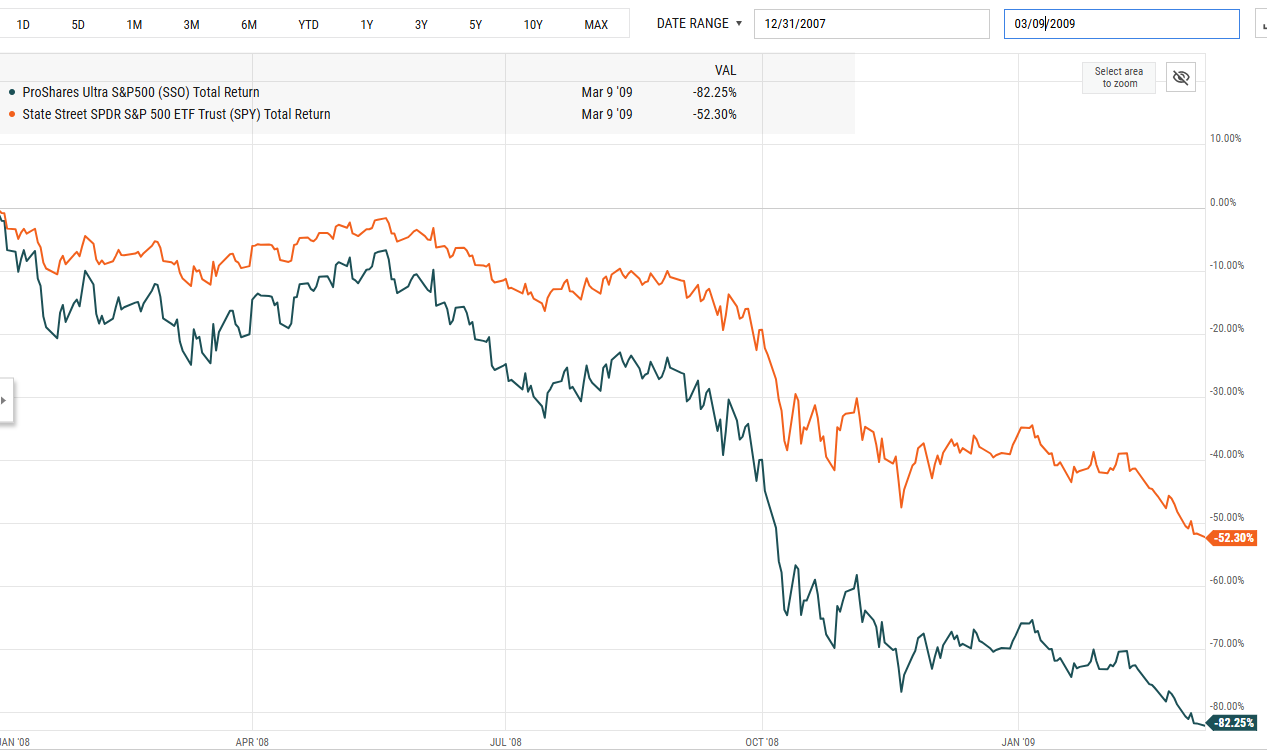
From the market peak at the end of 2007 through the market bottom in March 2009, the S&P 500 fell over 50%, and SSO fell by more than 82%. Imagine if your $1,000,000 portfolio fell to $180,000. That would feel dramatically worse than if you still had almost $500,000 in the unlevered asset. Furthermore, recovery from this depressed level took years. SPY total return got back to zero after about four years, at which time SSO was still down 35%. SSO did not catch up to SPY until early 2014, over 6 years after the market crashed. So not only would an SSO investor need to hold on for the 82% crash, but they’d also need to hold on for over six years just to match the return of the plain vanilla index, a rare combination of grit and patience. Hindsight is 20/20, and we know it would have worked out to hold through the long term, but in the moment, these decisions are never clear.
The Brightward Financial approach
We never recommend single-stock ETFs for client portfolios because the implied hurdle rate of return (60%+) is too high. For a levered ETF based on a broad index, perhaps, after a 35-50% market crash, they would suit our most aggressive accounts. But with expected equity returns where they are today, levered vehicles are decidedly poor risk-return currently.
References
Buffett, Warren E. 2003. "Chairman's Letter." In Berkshire Hathaway Inc. 2002 Annual Report. Omaha, NE: Berkshire Hathaway.
Cheng, Minder, and Ananth Madhavan. 2009. "The Dynamics of Leveraged and Inverse Exchange-Traded Funds." Journal of Investment Management 7 (4): 43–62.
ETF.com Staff. 2026. "Leveraged ETFs in 2026: How They Work, the Best Funds, and the Risks You Can't Ignore." ETF.com, July 16, 2026. https://www.etf.com/sections/news/leveraged-etfs-2026-how-they-work-best-funds-and-risks-you-cant-ignore.
FINRA. 2009. "Non-Traditional ETFs: FINRA Reminds Firms of Sales Practice Obligations Relating to Leveraged and Inverse Exchange-Traded Funds." Regulatory Notice 09-31, June 2009.
Guedj, Ilan, Guohua Li, and Craig McCann. 2010. "Leveraged and Inverse ETFs, Holding Periods, and Investment Shortfalls." Journal of Index Investing 1 (3): 45–57.
Murray, Chris, and Marco Sammon. 2026. "The Costs and Benefits of Leveraged ETFs." Working paper, August 17, 2026. SSRN. https://doi.org/10.2139/ssrn.7133021.
Roy, Sumit. 2025. "SEC Says No to 5x ETFs." ETF.com, December 3, 2025. https://www.etf.com/sections/features/sec-says-no-5x-etfs.
U.S. Securities and Exchange Commission. 2020. "Use of Derivatives by Registered Investment Companies and Business Development Companies." Release No. IC-34084, October 28, 2020. Federal Register 85, no. 245 (December 21, 2020): 83162.
U.S. Securities and Exchange Commission, Division of Investment Management. 2025. Staff comment letter to Direxion Shares ETF Trust regarding funds seeking more than 200% leveraged exposure, December 2, 2025. https://www.sec.gov/Archives/edgar/data/1424958/000000000025011179/filename1.pdf.
Important disclosures
Brightward Financial, LLC is an investment adviser registered with the State of Colorado. Registration does not imply a certain level of skill or training. This article is for informational purposes only and is not investment advice, an offer, or a recommendation to buy or sell any security. Funds and companies named here (including FAS, FAZ and NVDA) are discussed as examples, not recommendations. Leveraged and inverse ETFs seek a multiple of the daily return of an index or stock, can lose value quickly, and over periods longer than one day can return much less than the stated multiple, or lose money even when the underlying rises. Investing involves risk, including the possible loss of principal. Hypothetical examples are for illustration only and do not represent any actual investment. Third-party data are from sources we believe reliable but have not independently verified. Past performance does not guarantee future results.