The US stock market has created $91 trillion of shareholder wealth over the last 100 years, returning about 10% per year, yet the median stock returned negative 6.9%. What explains this staggering difference between the mean and median is that stock returns are highly skewed. A tiny fraction of high-returning stocks drives all the performance of the index. In this article, we dig into the data, consider implications for prudent investors, and make a contrarian argument for a certain type of active equity investment.
The positive skewness of equity returns
In March 2026, Dr. Hendrik Bessembinder of Arizona State University published a paper entitled One Hundred Years in the U.S. Stock Markets. The paper covers common stock issued by 29,081 U.S. public companies over the 100 years from 1926 to 2025. The paper produced the following key insights:
- 59% of firms returned less than T-bills (i.e. the investor would have been better off holding cash)
- 41% delivered a return greater than T-bills
- 3.7% of US firms accounted for 100% of the gains in shareholder wealth creation above T-bills
- 0.15% of all firms, merely 46 companies, created 50% of the total value above T-bills
The value creation leaders
- At the top of the leaderboard tables are many of the mega-cap tech leaders we all expect. Apple is ranked first, with $5.02 trillion in wealth creation, Nvidia ($4.58 trillion), Microsoft ($4.03 trillion), Alphabet ($3.57 trillion), Amazon ($2.27 trillion), and Broadcom ($1.60 trillion). These value-creation leaders were all listed in the last 50 years and are “new economy” companies.
- A separate leaderboard, ranked by cumulative return per dollar invested rather than total dollars created, surfaces many “old economy” companies: less glamorous names like Altria (tobacco), Vulcan Materials (crushed stone), Kansas City Southern (railways), IBM, and Coca-Cola. These companies achieved powerful, but not explosive, low-to-mid-teens compound annual returns. The caveat is that they did it for nearly 100 years. Quietly compounding at even 12% for 100 years produces incredible shareholder returns.
Asymmetry is a fundamental feature of equity investing
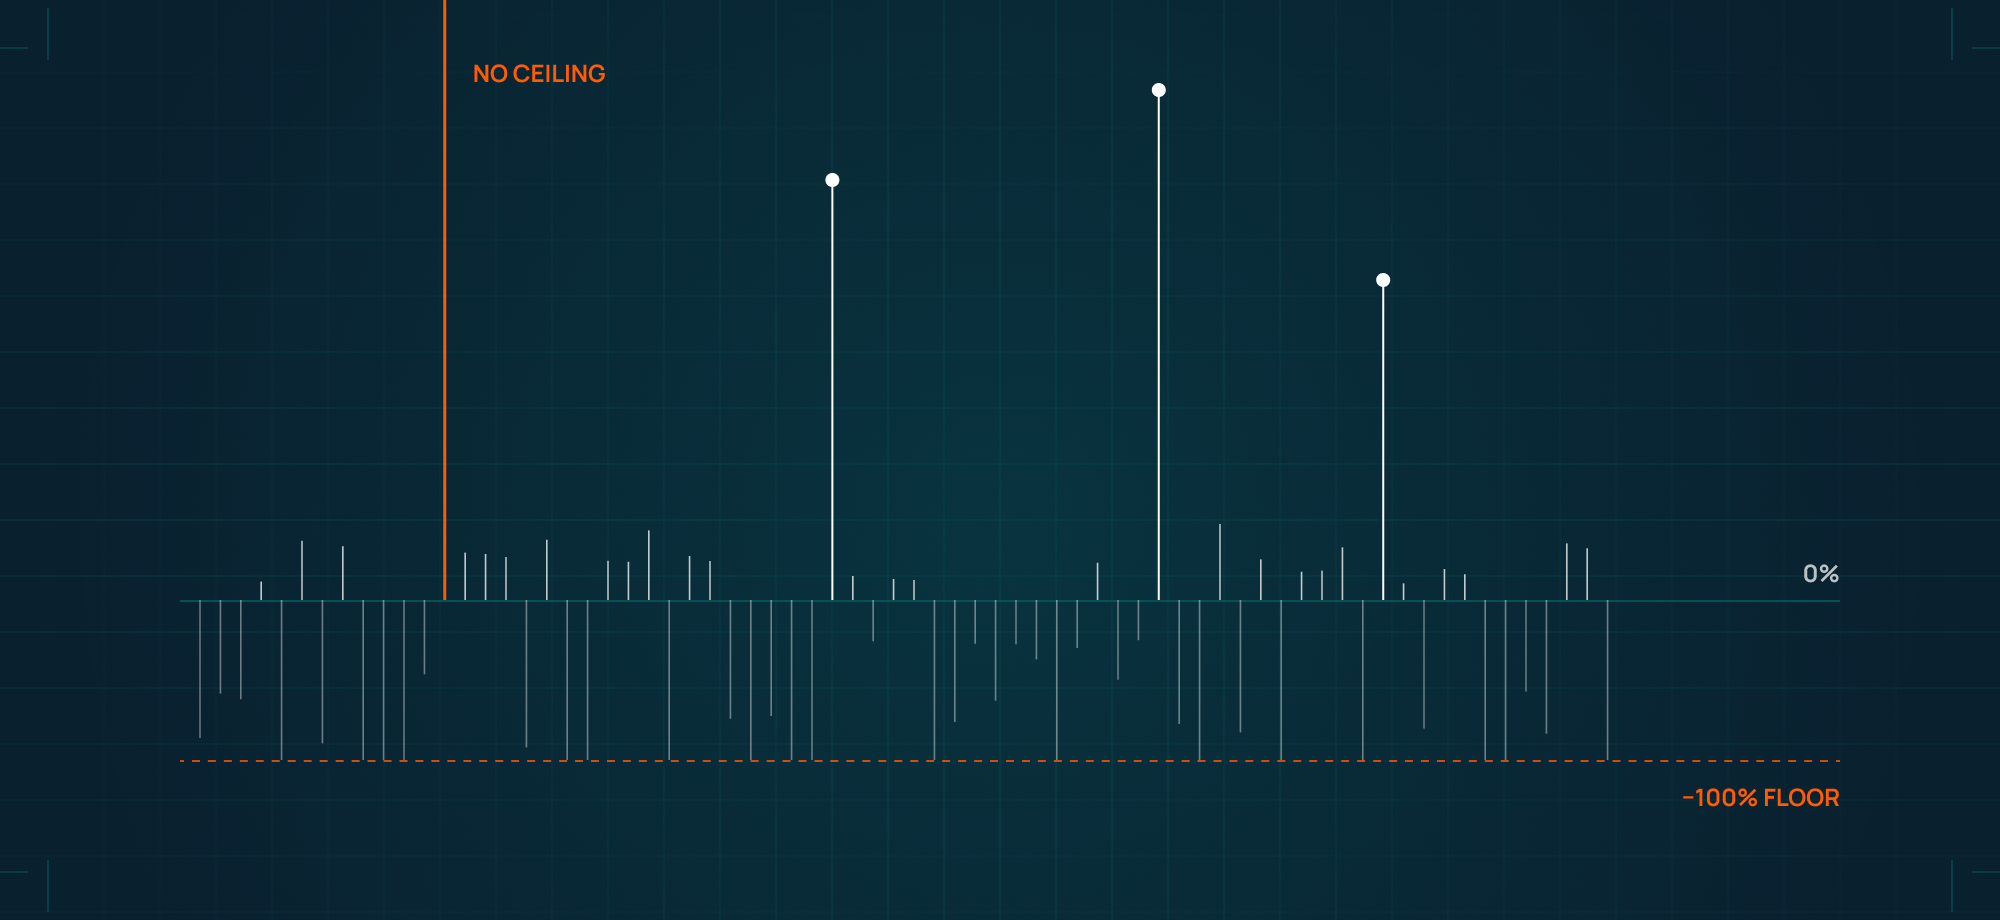
We all know that returns for a single stock are asymmetric: the most a stock can decline in value is by 100%, but the most it can go up (in theory) is infinite. This phenomenon is well understood in early-stage (angel and venture) investing, where investors know up front that most investments will be write-offs. Still, if they’re lucky, a few winners will more than compensate for the losers. It turns out that this skewness principle also holds in public markets, both domestically and internationally.
Implications for prudent investors
Core: diversified index exposure
The conventional conclusion is clear. Because so few firms account for all the gains (3.7%), favoring low-cost, broadly diversified index ETFs as the core of your portfolio is a sensible approach as it ensures you will own the asymmetric winners. You’ll also own all the losers, but due to the skewness of equity returns, the penalty for owning the losers is less than the benefit of owning the huge winners.
Satellite: tilting toward alpha
Our contrarian take is that the “100% passive” conclusion may leave some money on the table. We think the odds of picking winners are a little better than they seem at first, and with some human intelligence, we can further tilt them in our favor.
- The odds are better than they may appear. The headline figures measure each company’s entire listed life, and the median stock in the study was listed for only 6.8 years. Over decade-long horizons — closer to how our clients invest — 55% of stocks delivered positive returns and 49% beat T-bills. Beating the index remains a much higher bar, but the lifetime statistics overstate the difficulty for investors with realistic holding periods.
- Full lifecycle analysis. The Bessembinder study examines a company's full lifecycle. Of course, every company must eventually mature and decline. By emphasizing businesses that are not in terminal decline, we can shift the odds in our favor.
- New economy. Most of the largest dollar-value winners went public in the last 50 years and represent “new economy” companies. Although the hit rate for picking winners in the technology sector may be no higher than in other sectors, we believe the skewness of returns is even more extreme.
- Quiet compounders. Companies with durable competitive advantages and the ability to compound for many decades often end up in the short list of value-creating companies. These competitive advantages can take many forms: brand, network effects, distribution, or structural cost advantages. These stocks are the ultimate example of the truism that we tend to overestimate what we can achieve in a day but underestimate what we can achieve in a decade.
- Financial metrics. In our research, high return on invested capital and growth in invested capital seem associated with long-term value creation. Similarly, free cash generation and appropriate debt levels also seem common. (The study itself does not explore these factors.)
- Time horizon. We believe investors who can take a longer-term perspective have the best chance of being overallocated to the asymmetric winners. While an institutional imperative drives most money managers to perform within one or two percent of their benchmark every single year, benchmark-agnostic, long-term investors may be able to look beyond near-term volatility in pursuit of better long-run outcomes.
The Brightward Financial approach
At Brightward Financial, we seek to use modern research and financial science to build client portfolios. The skewness of equity returns, we believe, argues for a low-cost, diversified core exposure, but does not preclude an active approach designed to tilt toward the conditions that have historically produced asymmetric winners, with a long time horizon.
Sources
H. Bessembinder, “One Hundred Years in the U.S. Stock Markets,” March 2026 (data 1926–2025).
Important disclosures
Brightward Financial, LLC is an investment adviser registered with the State of Colorado. Registration does not imply a certain level of skill or training. This article is for informational purposes only and is not investment advice, an offer, or a recommendation to buy or sell any security. Companies named are historical examples from the cited study, not recommendations, and Brightward clients may or may not hold them. Investing involves risk, including the possible loss of principal. Concentrated portfolios and active strategies carry more risk than broadly diversified index portfolios and can trail the market for extended periods. Diversification does not guarantee a profit or protect against loss. You cannot invest directly in an index. Third-party data are from sources we believe reliable but have not independently verified. Past performance does not guarantee future results.