
Bottom line up front: For long-term portfolios, the risk of avoiding technology and a growing AI boom outweighs those of a possible bubble ready to pop. The revenue required to justify current AI investments, while high, is plausible. Earnings continue to make records, but it’s likely that companies are now earning too much per dollar of revenue relative to norms. A fall in earnings, though, does not necessarily mean a collapse in the broad market.
The numbers
| Index | Month | YTD |
|---|---|---|
| S&P 500 (SPY) | +2.68% | +13.08% |
| MSCI ACWI ex-US (ACWX) | +2.86% | +16.58% |
| Bloomberg US Aggregate (AGG) | +0.39% | -0.18% |
Total return as of Aug 31, 2026. ETF proxies are used for each index. MSCI ACWI ex-US is an all-world stock index that excludes US companies. Source: FactSet.
Earnings review
97% of companies have now reported their quarterly results, and with the S&P 500 seeing earnings grow by 52%1, the final figures are remarkable. This top-quintile2 quarterly growth is even more impressive because it is one of the few times in history when it did not occur after a recession.
Alphabet and Amazon distort the headlines with one-off numbers, reporting $98B and $53.5B in Other Income3 generated by the SpaceX IPO and latest Anthropic valuation, respectively. Excluding those line items, the Mag 74 still grew earnings 43.2%, while the remaining 493 companies grew 31.8%. Analysts expect 2026 to achieve earnings growth of 31.2%. This would be 5x nominal GDP growth over the same period.
Market prices have increased more slowly than earnings, meaning stocks are optically “cheaper” than a year ago. The price-to-earnings ratio5 of 19.6 is below the 22.2 it was then and below the 5-year average of 19.6. While the index remains above the long-term average of 16x, shifts from an industrial-led market to an information technology-led market make that reference point less relevant today. Altogether, this has shifted the bear narrative away from “markets are too expensive” to “companies are over-earning.”
Are we over-earning?
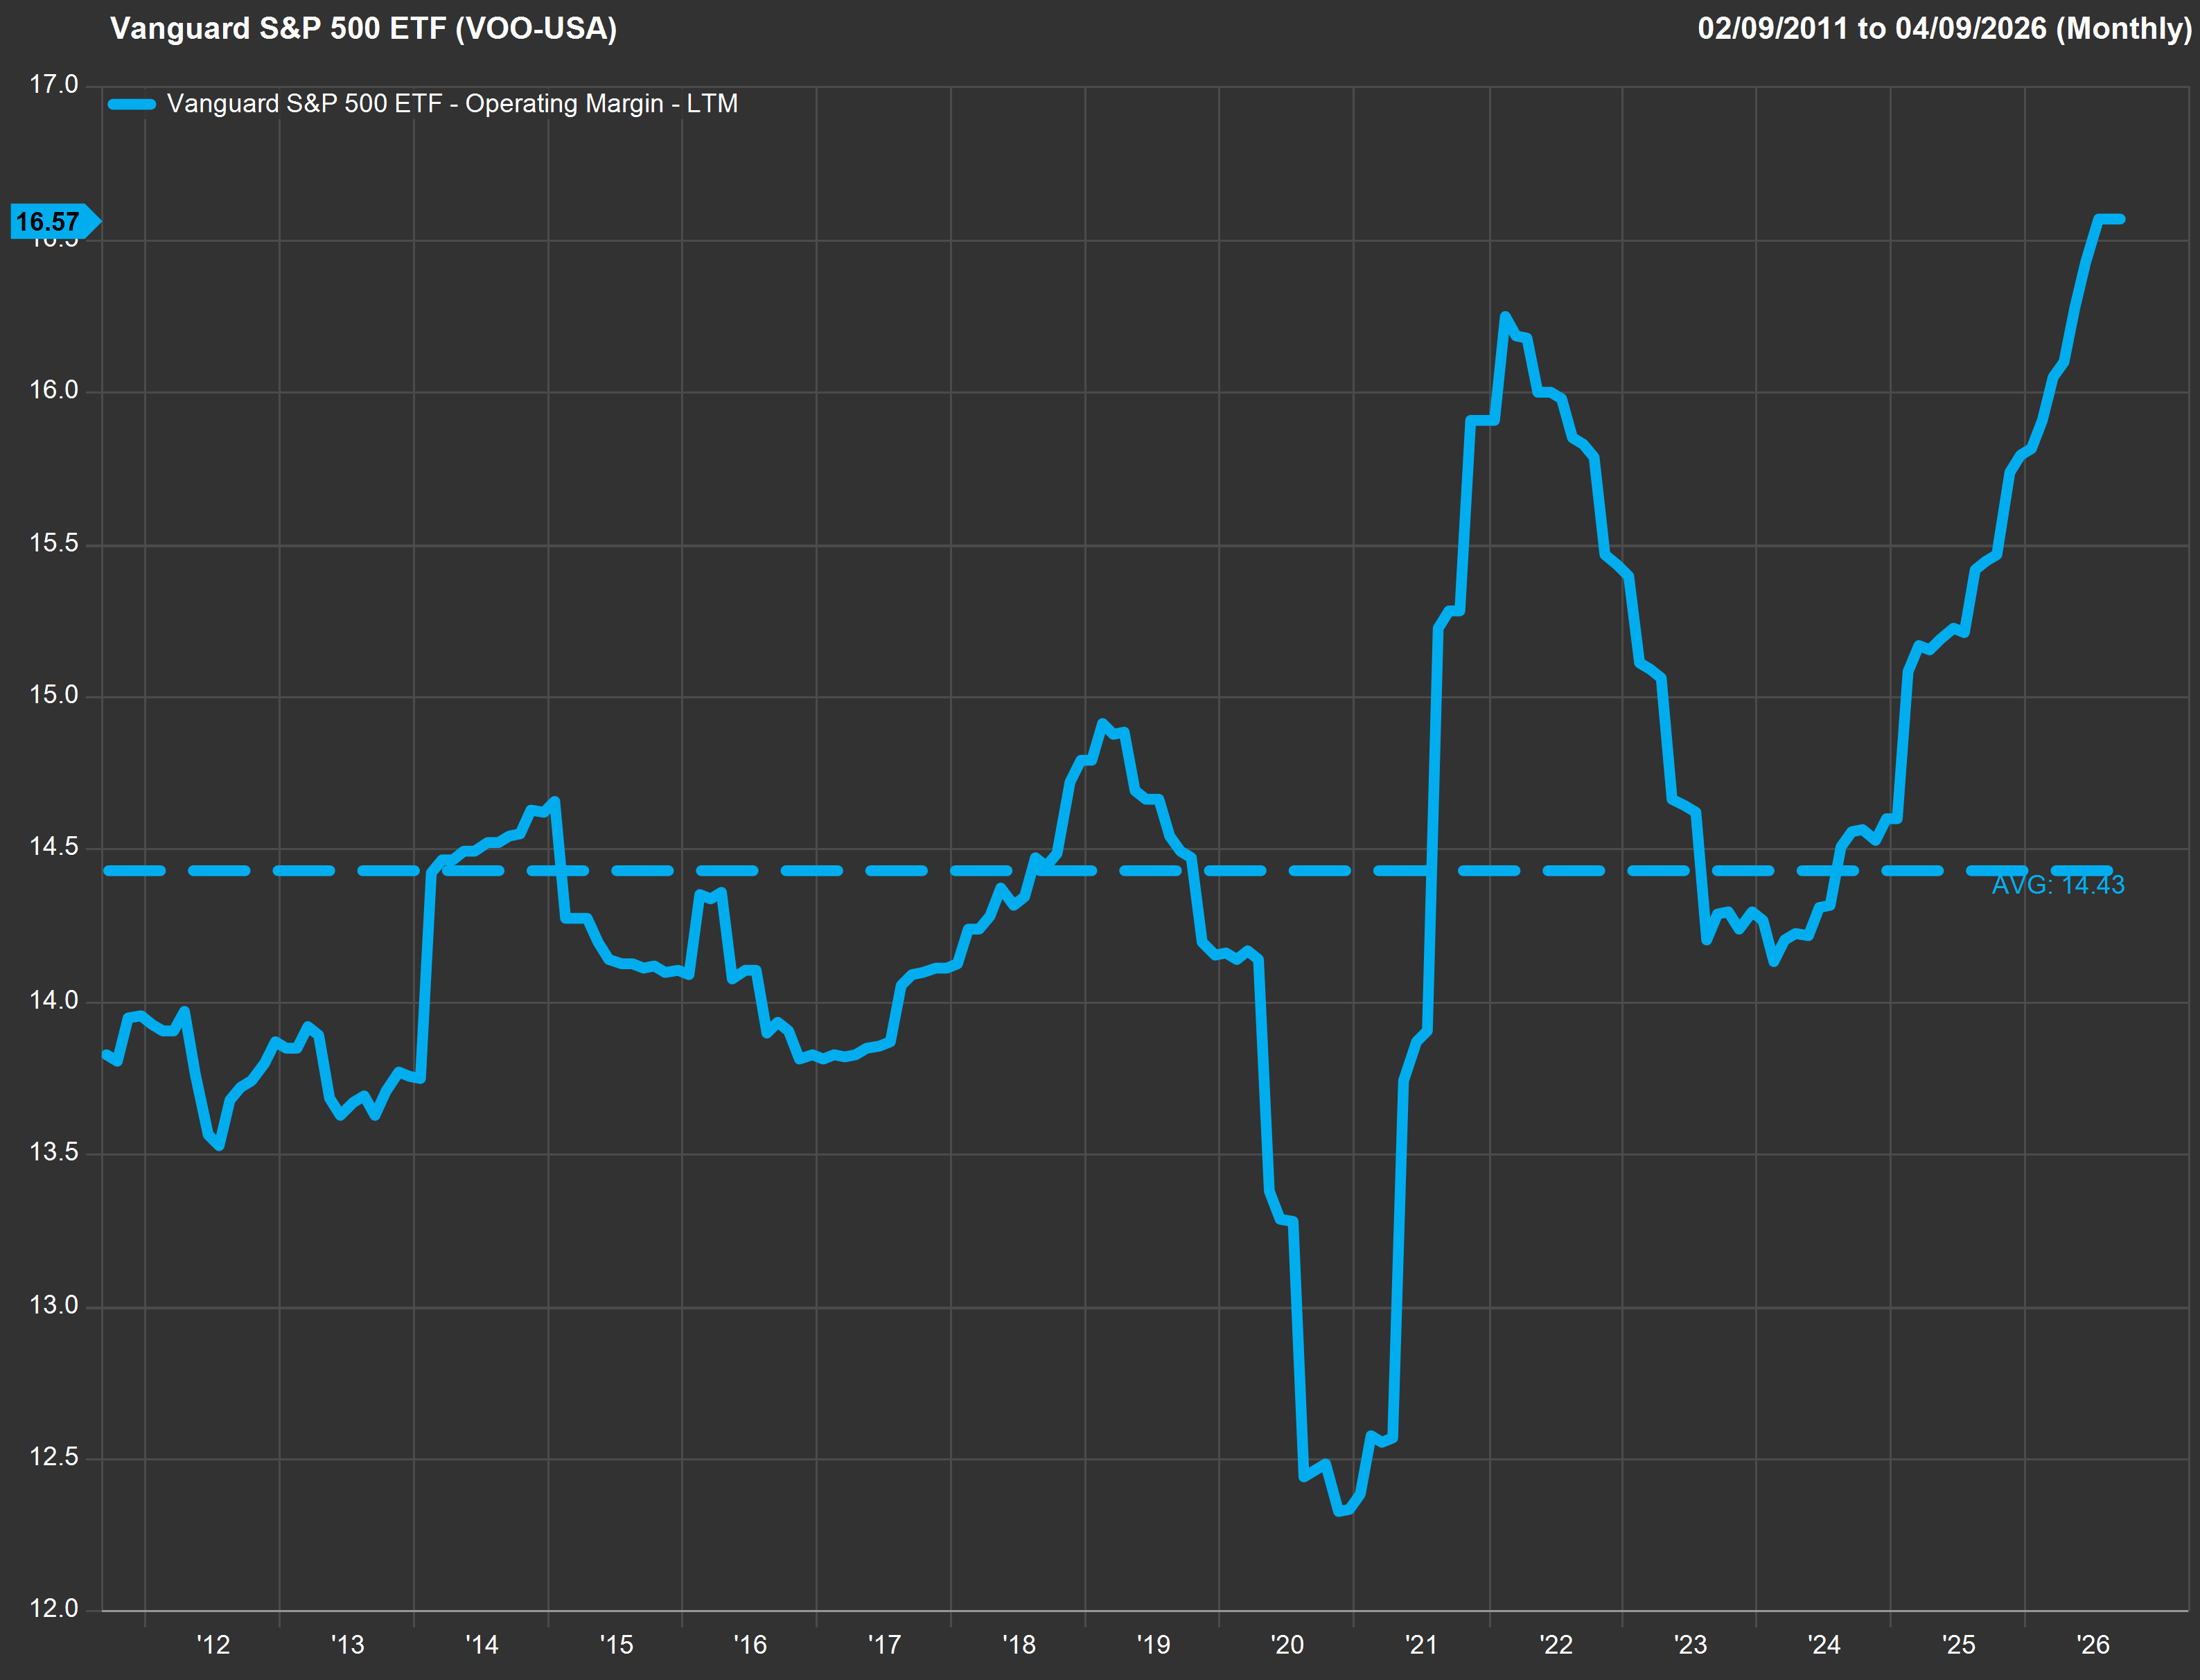
We define over-earning as generating levels of profit that are well above long-term historical averages and unlikely to be sustainable, and we believe much of the AI supply chain is over-earning today. Memory chips are one example: a DDR5 16Gb chip costs 5x as much today as it did one year ago. Micron, which has averaged a 16% operating margin for 15 years, today has a 66% operating margin. That’s over-earning, and it feeds through the broad market: the S&P 500 has an all-time high operating margin of 16.6% compared to a 15-year average of 13.5%.
Recent analysis by a firm we follow closely, Empirical Research Partners6, examined 75 S&P 500 companies that were the most likely over-earners. They found that if those companies reverted to normal margins, index earnings would fall by about 10%. While a useful starting point, this probably understates the risks if AI spending slows. Identifying an over-earning stock and profiting from that observation are not the same thing. Over-earning can continue for far longer than one might expect, and a few years of super-normal profits can have a positive recursive effect, creating sustainable, real value.
Another aspect of over-earning relates to the rules of accounting. Today's spending levels mechanically distort reported profits. When Microsoft spends $1 on Nvidia chips, Nvidia immediately books $1 in revenue. Because the chips have a multi-year life, Microsoft capitalizes the purchase and expenses roughly 13 cents this year, with the remaining 87 cents flowing through as depreciation over the following 7 years. So, at the aggregate market level, the transaction produces $1 of revenue against about 13 cents of expense. As the installed base ages, depreciation will become a growing headwind for chip buyers' reported earnings, even if free cash flow starts to recover.
A bet on the slope of the capability curve
We use AI every day at Brightward Financial. We complain about it every day too. The writing is verbose and uninspired. The images are eerie and soulless. AI-generated code is often 5x longer than it should be.
The bulls would say we are missing the point. AI is a bet on the slope of the curve. In 2022, these models could not do basic arithmetic. This year, one disproved an 80-year-old Erdős conjecture7 that no mathematician had solved. Math may be a domain these systems are especially suited to, but that is still a 4-year trip from 2nd-grade arithmetic to publishable research.
What if AI capability continues to expand exponentially? If AI wrote twice as well as it does today? If agentic AI became twice as capable and half as fiddly to deploy? Right now, it functions as a good intern, but what if it had the capabilities of a mid-career employee? What if it became as good as a top employee? We’re still far from that reality, but it’s a possible future.
The loudest futurists told us the takeover would be well underway by late 2026. Even if they were right about the models, they have been wrong about the real-world impact. There has been no job apocalypse. We see four main reasons:
- AI is still surprisingly useful one moment and frustratingly useless the next.
- Gains in AI benchmarks have not directly translated to real-world capabilities. A model that doubles its test score might be only 20% more useful in real-world work.
- It remains a productivity enhancer rather than a workforce replacement.
- Deployment is slow by nature. Like enterprise software before it, AI demands reordered workflows, specialized skills, and constant tinkering. It does not (yet) drop in and start adding value.
How much revenue would justify the AI capital expenditure?
The capital going into this is astonishing. Consensus now expects $1 trillion of AI investment in 2027, and most analysts assume it will climb from there. Our estimates indicate that it will take $2 trillion in annual recurring revenue to achieve at least a 10% return on investment.
$2 trillion is real money—and that’s just to hit a 10% return on investment. A 20% return would require revenue closer to $4 trillion (double the combined 2025 revenue of the Mag 7). $2 trillion additional revenue would increase the entire S&P 500 by 11%. Could AI increase the market’s revenue by 22% to achieve a more desirable 20% return on investment? Our sense is that $2 trillion is plausible. $4 trillion is challenging.
If AI never develops beyond where it is today, it would be a genuinely useful tool, but that’s far short of becoming a disruptive, general-purpose technology. If it continues to develop, we should expect tipping points and a step function in adoption, going from useful for tech-savvy users to inevitable for the public. Our main concern is timing. The real-world usefulness of AI appears to be increasing linearly, while model capabilities and costs compound at much faster rates. If the necessary doubling in “usefulness” takes 5 years instead of 1, today's expectations are too high.
How we're positioned
We’re not running for cover because we see a plausible path to favorable outcomes. We’re not YOLO-ing into the AI supply chain either because we worry about the over-earning risks. A balanced approach is justified based on our assessment of the required revenue and the slope of the AI capability curve. While the current setup skews negatively, it’s not a slam dunk that we’re in a bubble. We also know that betting against technological development has historically been a bad bet.
In our portfolios, we’re shifting more toward value stocks over growth. We are keeping our skew to US companies over international but are further refining international by reducing investments in Europe and China and favoring Developed Asia. While we still like the tech sector, we also like healthcare and continue to invest there.
What we're reading
How much of the internet is written with AI (Pew Research Center)
Notes
- The 20-year average is 7.5%.
- Top 20% of quarters in the history of the S&P 500.
- Other Income includes inflows outside of revenue generated by normal operations (e.g. interest income, gains on asset sales, investment gains, licensing income, etc.).
- The "Magnificent 7" includes Alphabet, Amazon, Apple, Meta, Nvidia, Tesla.
- Price-to-earnings (P/E) is a stock price per share divided by its earnings per share.
- Empirical Research Partners
- AI just solved an 80-year-old Erdős problem, and mathematicians are amazed (Scientific American)
Important disclosures
Brightward Financial LLC is a Registered Investment Advisor in the State of Colorado that provides investment advisory services, financial planning, and wealth management to individuals and businesses. Advisory services are offered only to clients and prospective clients where Brightward Financial LLC and its representatives are properly registered or exempt from registration. Nothing in this article should be construed as a solicitation or offer to sell advisory services in any jurisdiction where Brightward Financial LLC is not registered or exempt.
This article is provided for general informational purposes only and should not be considered personalized investment advice or a recommendation to buy or sell any security. Opinions expressed are those of Brightward Financial LLC as of the date of publication and are subject to change without notice.
This article may contain forward-looking statements, including earnings estimates, price targets, valuations, and projected financial results. Actual results may differ materially from those anticipated, and forward-looking statements are not guarantees of future performance.
All investments involve risk, including the potential loss of principal. Past performance is not indicative of future results. Index returns are unmanaged, do not reflect the deduction of fees or expenses, and are not available for direct investment.
Information in this article is sourced from publicly available data believed to be reliable but not independently verified. Brightward Financial LLC makes no representation or warranty, express or implied, as to its accuracy, completeness, or timeliness.
Brightward Financial LLC and its principals, employees, or affiliates may hold long or short positions in securities mentioned here, and any such positions held at the time of publication are disclosed in the relevant content. As of the date of publication, Brightward Financial LLC and/or its principals hold long positions in Micron, Microsoft, and Meta. Brightward Financial LLC does not accept compensation from any company mentioned in this article in exchange for favorable coverage or commentary.
Brightward Financial LLC's Form ADV Part 2A and Part 2B describe our advisory services, fees, and material conflicts of interest in greater detail. Both are available upon request and at adviserinfo.sec.gov.